Good monitoring is set up correctly once and then reports automatically: activated fault messages take over everyday life, you briefly look at the curve every month and update the annual values once a year. More important than looking into it daily is the correct reaction to two signals – fault message and unexplained reduced yield. (As of: July 2026)
Key points in brief
- Monitoring discovers what you cannot see from the outside: a stationary system looks exactly the same from the street as a producing one.
- Half the battle is the setup: activate fault messages, test delivery – a message that no one reads is not one.
- Looking at the app daily achieves nothing; the effective rhythm is automatic (fault messages), monthly (a glance) and annually (noting values).
- The app figure and the grid operator's bill never match exactly – they measure at different points. Rough plausibility is sufficient.
- Rule of thumb for the professional call: deviation of more than around 10 per cent compared to previous years without a weather explanation.
What does monitoring achieve – and what does it not?
Solar systems work silently and without moving parts – their greatest strength and at the same time their only real weakness: a failure does not announce itself, it is simply there, and without monitoring it remains invisible. The cases that reach us in retrospect almost always follow the same pattern: the failure would have been visible in the app for months, only nobody looked into it. Monitoring turns this «months» into «days» – that is its core task, and surprisingly little effort is sufficient for this.
Equally important is the honest limit: monitoring does not automatically show every gradual reduced yield. Growing shading or a single weak module do not trigger an error message – they hide in the curve and only become visible through comparison with previous years. That is why good monitoring consists of two halves: the automatic messages for hard failures and the annual comparison for the gradual ones.
The setup: once correctly, then peace and quiet
The foundation is laid at the handover – or not. Three points belong on the acceptance checklist:
1. Activate and test fault messages. Every modern inverter reports errors via app or e-mail – but only if the function is set up and the messages arrive. Check the spam folder and ask to be shown a test message at handover. 2. Secure your own access. App account in your name, access data in the system dossier – not just on the installer's mobile phone. If the company changes later, you retain access. 3. Note starting values. Date of commissioning and the first monthly values form the baseline against which all subsequent years are compared.
Anyone who has taken over an existing system – for example when buying a house – is best advised to catch up on these three points immediately: have access transferred, messages to your own address, note values from takeover.
Which values should I look at anyway?
The apps show more than you need – three views are decisive:
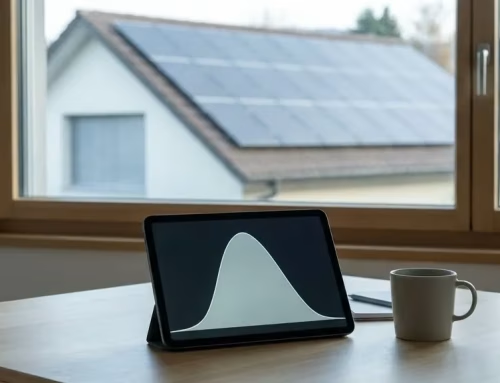
The daily curve is the quick health check: a clean curve from sunrise to sunset means the system is alive. Drops at the same time every day indicate a moving shadow – chimney, tree, neighbouring house.
The monthly and annual comparison is the actual instrument: this shows whether the system is in line with previous years. Every year fluctuates due to the weather; suspicious is the trend over several years or the drop without a weather explanation – natural degradation only explains a small, uniform decline.
The string comparison, if the app provides it: if two similar strings suddenly deliver unequally, troubleshooting is already half done – the deviation shows where the problem lies on the roof.
Self-consumption and feed-in values round off the picture, but belong more to optimisation than to supervision – for monitoring, the first priority is: is the system producing what it should?
The right rhythm: how often to look?
The honest answer contradicts the first impulse of new system owners: looking daily achieves nothing – and experience shows that the initial enthusiasm subsides after a few weeks anyway. A tiered rhythm is effective:
| Rhythm | What | Effort |
|---|---|---|
| automatically | fault messages arrive automatically | 0 – set up once |
| monthly | a glance at the curve and monthly value | 2 minutes |
| annual | note annual value, compare with previous years, annual check | 30 minutes |
Recommendation for typical single-family home systems, As of: July 2026 – tighter rhythms apply to ZEV and business systems with billing obligations.
The monthly glance has an underestimated side benefit: it also discovers the failure of the monitoring itself. An app that has received no data since the router was changed, while the system outside produces flawlessly, is one of the most common «defects» of all – a connection problem, not a system problem, but it blinds you for weeks.
Why do the app and the electricity bill never match?
The classic in the first year of operation: the grid operator's annual bill shows a different feed-in than the app – and suspicion falls on either the utility or the installer. Usually wrongly: the app measures at the inverter, the grid operator at their meter – in between lie consumption in the house and measurement tolerances. The two figures describe different points in the electricity flow and cannot be identical at all.
Rough plausibility is sufficient for monitoring: if the order of magnitude fits, everything is fine. How you read the bill yourself item by item – and when a difference is nevertheless worth querying – is explained in a separate article.
When is a deviation a case for the professional?
The proven threshold: a deviation of more than around 10 per cent compared to previous years that cannot be explained by the weather. Then the order applies from simple to complex – check fault messages, string comparison, visual inspection from the ground, then the call to the specialist company. And with well-maintained monitoring including noted annual values, precisely this call is short and cheap: the company immediately sees what you are talking about, instead of starting with «something is wrong».
For service calls, our first action is almost never the journey, but a look into the monitoring portal – provided the customer has given us access. In many cases, the diagnosis is thus made in minutes: read the fault code, remote assessment, targeted journey with the right spare part – or the all-clear that only the app's internet connection is stuck and everything on the roof is running. Without access, the same conversation begins with descriptions from memory and more often ends in a journey on suspicion. Our recommendation from this is simple: give your company monitoring clearance – revocable, transparent, and in the event of a fault the difference between a phone call and an appointment.
Frequently asked questions
Does the monitoring cost anything?
The basic apps of the inverter manufacturers are usually free of charge and fully sufficient for a single-family home. Chargeable portals and additional services are particularly worthwhile where there are billing obligations – for instance with ZEV or business systems.
Can my installer monitor the system remotely?
Yes – with your clearance in the monitoring portal. This significantly accelerates any diagnosis and can be revoked at any time. Some companies offer active monitoring as a service; however, for the typical single-family home, clearance for the event of a fault is usually sufficient.
The app no longer shows any data – is the system broken?
Usually not: the most common reason is an interrupted internet connection, for example after a router change – the system continues to produce normally. First check the inverter's connection; only if this is established and still nothing comes is it a case for the company.
Is the monitoring app sufficient as proof for warranty and billing?
As an indication yes, as proof only to a limited extent – the grid operator's meter is relevant for billing, not the app. For warranty cases, the documented history counts: noted annual values and reported faults make every claim faster and more credible.
What is best to note down per year?
Annual production according to the app, feed-in according to the bill and special events – faults, repairs, exceptional weather. Five numbers and two lines per year are sufficient; together with the system documents, this results in a dossier that is worth ready cash in the event of a warranty, troubleshooting and house sale.
Free initial consultation
Is your monitoring running – or just your system?
We set up fault messages and access cleanly, check the history and take over remote monitoring on request – even for systems that were not built by us.
Prefer to talk? +41 78 830 83 35
Have a photovoltaic system installed →
Swissolar member and Solarprofi · ESTI installation authorisation (Art. 14 NIV) · in Zurich since 2017 · over 150 systems completed · a personal answer from the specialist company, no call centre
Further guides
 Solaranlage im Betrieb: Wartung & MonitoringWeiterlesen
 Der Jahres-Check: Checkliste für AnlagenbesitzerWeiterlesen
 Messung und Zähler: Wer misst was?Weiterlesen
 Degradation von SolarmodulenWeiterlesen
 Stromabrechnung verstehenWeiterlesen
Sources: Manufacturer documentation (monitoring systems); empirical values from the service and installation practice of ecoEn GmbH, Zurich region.
Last updated: 9 July 2026 · Author: ecoEn editorial team