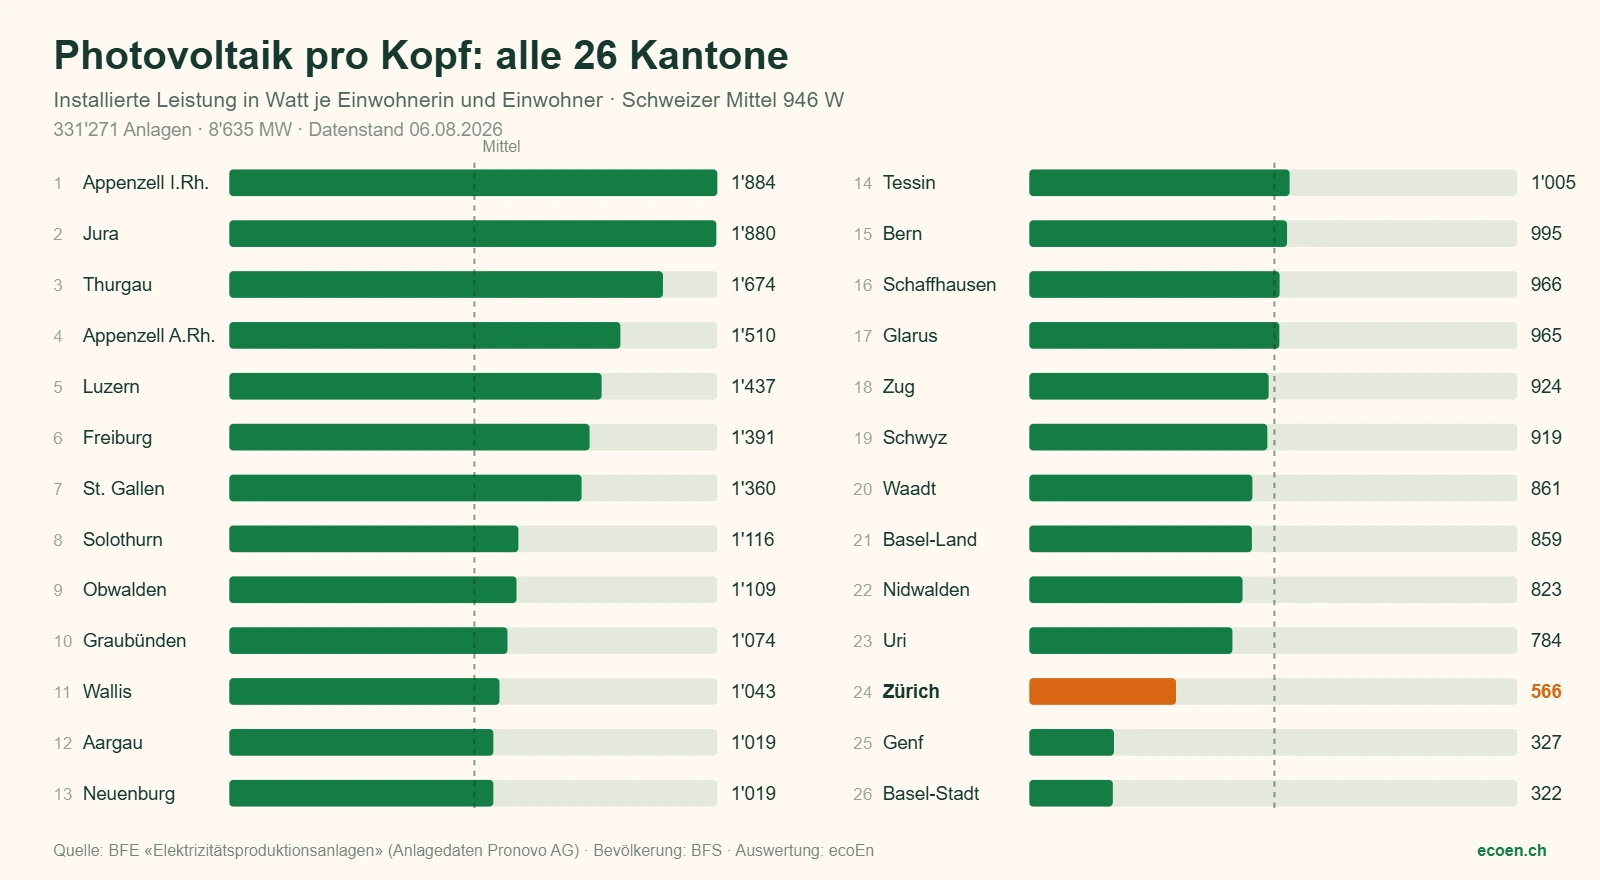
At the end of 2025, Switzerland had 338,270 photovoltaic systems with 9,498.6 MW installed – a good 14 percent of Swiss electricity consumption. 2025 saw 1,333 MW added, a quarter less than in 2024: the first decline since 2017. Per capita, Appenzell Innerrhoden leads with 1,884 watts, while Zurich, at 566 watts, ranks only 24th of 26 – despite the country's second-highest total installed capacity. (As of August 2026)
Key points in brief
- The per-capita ranking turns the usual picture on its head: rural cantons lead, while the big economic cantons of Zurich, Geneva and Basel-Stadt form the bottom group.
- Zurich has a lot of capacity, but little capacity per person – a density problem, not an expansion problem.
- The typical Swiss system is small: the median is around 12 kWp, and 87 percent of all systems stay under 30 kWp.
- The roof-integrated share has fallen from around 20 percent (2010–2013) to 8.1 percent (2024) – it has held up most strongly in the mountain and tourism cantons.
- All structural figures come from the federal government's public installation register and can be recalculated with the script in the Methodology chapter.
How much photovoltaics does Switzerland have?
For the national key figures, the «Statistik Sonnenenergie» applies, which Swissolar collects annually on behalf of the Federal Office of Energy and publishes at the start of July. The edition of 10 July 2026 reports for the year 2025:
| Metric | Value (end of 2025) |
|---|---|
| Total installed capacity | 9,498.6 MW |
| Number of systems | 338’270 |
| Share of Swiss electricity consumption | 13,71 % |
| New installations 2025 | 1,333 MW |
| New installations 2024 | 1,800 MW |
| Change | −26 % |
Source: Swissolar, «Statistik Sonnenenergie 2025», published on 10 July 2026 on behalf of the SFOE.
The decline in 2025 is the first since 2017. Swissolar attributes it to the falling feed-in remuneration after the 2022 electricity price spike and to uncertainty in federal energy policy. What the remuneration means concretely in the region is worked through in the feed-in tariff comparison.
Storage is moving in the opposite direction: installed battery capacity rose in 2025 from 0.884 to 1.38 GWh – an increase of a good half within a single year. The market is thus shifting from pure new installations to optimising self-consumption.
Which canton has the most solar power per capita?
The following table analyses 331,271 photovoltaic systems from the federal installation register and compares them with the permanent resident population. «Watts per capita» is the more meaningful measure here than absolute capacity: it shows how far a canton has exhausted its own roof potential.
| Rank | Canton | Systems | Capacity (MW) | Watts/capita | Ø system (kWp) | Roof-integrated share |
|---|---|---|---|---|---|---|
| 1 | Appenzell Innerrhoden | 1’259 | 31,8 | 1’884 | 25,3 | 29,1 % |
| 2 | Jura | 5’652 | 141,3 | 1’880 | 25,0 | 5,6 % |
| 3 | Thurgau | 16’931 | 507,0 | 1’674 | 29,9 | 5,6 % |
| 4 | Appenzell Ausserrhoden | 3’835 | 86,4 | 1’510 | 22,5 | 16,0 % |
| 5 | Luzern | 16’919 | 634,6 | 1’437 | 37,5 | 8,6 % |
| 6 | Freiburg | 21’753 | 488,0 | 1’391 | 22,4 | 10,3 % |
| 7 | St. Gallen | 26’329 | 739,8 | 1’360 | 28,1 | 10,3 % |
| 8 | Solothurn | 11’040 | 325,4 | 1’116 | 29,5 | 8,1 % |
| 9 | Obwalden | 1’395 | 44,2 | 1’109 | 31,7 | 22,4 % |
| 10 | Graubünden | 8’704 | 222,8 | 1’074 | 25,6 | 27,5 % |
| 11 | Wallis | 18’466 | 392,4 | 1’043 | 21,2 | 22,9 % |
| 12 | Aargau | 25’869 | 757,8 | 1’019 | 29,3 | 6,8 % |
| 13 | Neuenburg | 8’141 | 183,7 | 1’019 | 22,6 | 10,6 % |
| 14 | Tessin | 16’973 | 361,6 | 1’005 | 21,3 | 2,8 % |
| 15 | Bern | 40’649 | 1’071,1 | 995 | 26,4 | 18,8 % |
| 16 | Schaffhausen | 3’344 | 87,0 | 966 | 26,0 | 5,8 % |
| 17 | Glarus | 1’445 | 41,0 | 965 | 28,3 | 27,0 % |
| 18 | Zug | 3’056 | 124,7 | 924 | 40,8 | 7,3 % |
| 19 | Schwyz | 5’027 | 156,4 | 919 | 31,1 | 16,7 % |
| 20 | Waadt | 37’086 | 743,8 | 861 | 20,1 | 20,3 % |
| 21 | Basel-Landschaft | 11’453 | 261,2 | 859 | 22,8 | 6,8 % |
| 22 | Nidwalden | 1’052 | 37,6 | 823 | 35,7 | 15,5 % |
| 23 | Uri | 1’205 | 30,2 | 784 | 25,1 | 6,2 % |
| 24 | Zurich | 32’829 | 923,6 | 566 | 28,1 | 11,6 % |
| 25 | Genf | 8’432 | 175,7 | 327 | 20,8 | 7,8 % |
| 26 | Basel-Stadt | 2’427 | 65,8 | 322 | 27,1 | 14,6 % |
| Switzerland | 331’271 | 8’635 | 946 | 26,1 | 12,7 % |
Our own analysis of the SFOE register «Electricity production plants» (data as of 6 August 2026), population according to FSO STAT-TAB, permanent resident population 2025. For the difference between these 8,635 MW and the official 9,498.6 MW, see Methodology.
Three patterns stand out:
The top is rural. Appenzell Innerrhoden, Jura and Thurgau reach three to six times the levels of the city cantons. Where single-family homes, farms and commercial halls shape the built landscape, there's simply more of your own roof area per person – and fewer shared decision paths to a construction decision.
Systems get largest where business is located. Zug leads with an average of 40.8 kWp, followed by Luzern (37.5) and Nidwalden (35.7). These are no longer single-family home figures, but commercial and apartment building roofs.
The roof-integrated share follows the landscape, not purchasing power. Appenzell Innerrhoden (29.1%), Graubünden (27.5%) and Glarus (27.0%) build integrated systems three to ten times more often than Tessin (2.8%) or Thurgau (5.6%) – more on this in the Roof-integrated chapter.
Why does Zurich rank only 24th per capita?
Zurich is the canton with the second-highest installed capacity in Switzerland (923.6 MW, behind Bern) and, with 32,829 systems, the third-largest stock. Per capita, that's still only enough for 566 watts – around 40 percent below the Swiss average of 946 watts and less than a third of the leader.
The reason is the settlement structure, not a lack of will: a canton with 1.63 million residents has many people per square metre of roof. Apartment buildings, condominium ownership and rental arrangements also lengthen the path from interest to a construction decision – there, models like the self-consumption community are needed, not just a quote.
What's remarkable is how stable this finding is: calculating the ranking at three different reference dates (end of 2023, end of 2024, current data), Zurich lands at rank 24 every time. The gap is therefore structural, not the artefact of a single year.
For owners in the region, this means one thing above all: the neighbourhood is not a good yardstick for whether a roof pays off. Whether it's worthwhile is decided by orientation, pitch, shading and self-consumption – that's what roof suitability checks, not the statistics.
How big is a typical Swiss solar system?
| System size | Number | Share |
|---|---|---|
| under 10 kWp | 123’120 | 37,2 % |
| 10 to 30 kWp | 164’525 | 49,7 % |
| 30 to 100 kWp | 30’799 | 9,3 % |
| 100 to 1,000 kWp | 12’473 | 3,8 % |
| from 1,000 kWp | 354 | 0,1 % |
Our own analysis, data as of 6 August 2026. Median: 12.1 kWp. Arithmetic mean: 26.1 kWp.
The figures correct a widespread picture. Almost nine out of ten systems (86.9%) stay under 30 kWp – that's single-family home scale. Switzerland's PV stock doesn't consist of large power plants, but of hundreds of thousands of small roofs.
The fact that the mean (26.1 kWp) is more than double the median (12.1 kWp) also shows how strongly the 354 systems of a megawatt or more pull the average upwards. Anyone comparing cost figures should therefore always pay attention to system size – what a 10 kWp system costs can't be scaled up linearly to 100 kWp.
Why is the roof-integrated system disappearing from the statistics?
With a roof-integrated system, the modules replace the tiles instead of lying on top of them. The register lists this as its own category – and the share has halved over fifteen years:
| Year of commissioning | Systems | Roof-integrated share |
|---|---|---|
| 2013 | 7’226 | 20,1 % |
| 2016 | 10’625 | 18,9 % |
| 2019 | 14’531 | 19,0 % |
| 2020 | 19’488 | 17,3 % |
| 2021 | 23’320 | 14,8 % |
| 2022 | 33’750 | 11,8 % |
| 2023 | 61’694 | 8,7 % |
| 2024 | 57’564 | 8,1 % |
Our own analysis by year of commissioning. 2025 and 2026 can't yet be conclusively assessed because of the registration lag and are therefore not shown – see Methodology.
The break coincides with the boom: from 2022, annual new installations doubled, and the share of integrated systems collapsed. The obvious reading is that in an overheated market, the faster-to-install on-roof system wins out – roof-integrated systems require more planning, more roofing craftsmanship and a clear rule on who's liable for weatherproofing.
Regionally, however, the picture remains very different:
| Highest roof-integrated share | Lowest roof-integrated share | ||
|---|---|---|---|
| Appenzell Innerrhoden | 29,1 % | Tessin | 2,8 % |
| Graubünden | 27,5 % | Thurgau | 5,6 % |
| Glarus | 27,0 % | Jura | 5,6 % |
| Wallis | 22,9 % | Schaffhausen | 5,8 % |
| Obwalden | 22,4 % | Uri | 6,2 % |
The top group consists of mountain and tourism cantons – where townscape and heritage protection rules more often require that a system doesn't stand proud of the roof. Building regulations thus become the driver of construction method. In the Canton of Zurich, the share is 11.6 percent, corresponding to 3,813 integrated systems.
When the more elaborate construction method pays off anyway, and what it costs extra, is covered by the roof-integrated system comparison and the in-roof/on-roof cost comparison.
How many solar systems are in my municipality?
| Location | Canton | Systems | Capacity (MW) | Ø system (kWp) |
|---|---|---|---|---|
| Zurich | ZH | 2’445 | 96,25 | 39,4 |
| Winterthur | ZH | 2’514 | 74,65 | 29,7 |
| Frauenfeld | TG | 1’025 | 39,06 | 38,1 |
| Baar | ZG | 429 | 23,62 | 55,1 |
| Wetzikon | ZH | 666 | 19,86 | 29,8 |
| Zug | ZG | 398 | 16,98 | 42,7 |
| Volketswil | ZH | 302 | 15,94 | 52,8 |
| Regensdorf | ZH | 118 | 15,46 | 131,1 |
| Uster | ZH | 623 | 14,00 | 22,5 |
| Cham | ZG | 281 | 13,94 | 49,6 |
| Schlieren | ZH | 142 | 12,83 | 90,4 |
| Illnau-Effretikon | ZH | 366 | 11,87 | 32,4 |
| Dietikon | ZH | 282 | 11,00 | 39,0 |
| Wallisellen | ZH | 306 | 10,96 | 35,8 |
| Bülach | ZH | 335 | 10,44 | 31,2 |
| Kloten | ZH | 292 | 10,41 | 35,7 |
| Dübendorf | ZH | 321 | 9,96 | 31,0 |
| Rüti | ZH | 467 | 9,90 | 21,2 |
| Lenzburg | AG | 267 | 9,85 | 36,9 |
| Wädenswil | ZH | 330 | 9,79 | 29,7 |
| Wettingen | AG | 428 | 9,37 | 21,9 |
| Horgen | ZH | 387 | 9,04 | 23,4 |
| Meilen | ZH | 340 | 8,89 | 26,2 |
| Stäfa | ZH | 277 | 7,26 | 26,2 |
| Adliswil | ZH | 249 | 7,18 | 28,8 |
| Baden | AG | 230 | 6,52 | 28,4 |
| Brugg | AG | 215 | 6,48 | 30,1 |
| Küsnacht | ZH | 258 | 5,91 | 22,9 |
| Thalwil | ZH | 259 | 5,67 | 21,9 |
| Uetikon am See | ZH | 196 | 4,44 | 22,7 |
| Pfäffikon SZ | SZ | 116 | 4,03 | 34,7 |
| Fällanden | ZH | 84 | 3,75 | 44,7 |
| Zollikon | ZH | 124 | 2,26 | 18,2 |
| Freienbach | SZ | 55 | 2,01 | 36,5 |
| Rüschlikon | ZH | 88 | 1,97 | 22,4 |
Our own analysis, data as of 6 August 2026. The register lists the postal locality, not the political municipality; outlying hamlets were attributed accordingly (Winterthur from 5, Illnau-Effretikon from 2 localities). Pfäffikon SZ is a locality of the municipality of Freienbach and is therefore shown separately.
The «Ø system» column reveals more about a locality than total capacity. Regensdorf averages 131.1 kWp – with only 118 systems. There, capacity sits almost entirely on commercial and industrial roofs, not on single-family homes. What a system on a hall roof costs and how much of that stays in the business is worked through in the guide for businesses and SMEs. A similar, if weaker, pattern appears in Schlieren (90.4 kWp) and Baar (55.1 kWp).
At the other end are places like Zollikon (18.2 kWp), Rüti (21.2) and Thalwil (21.9): many small roofs, little business. Different orders of magnitude and different viability calculations apply to commercial roofs – see the overview for business and industry.
How were these figures produced?
This page deliberately mixes two sources with different roles – and is transparent about where the limits lie.
National annual figures (total stock, new installations, share of consumption, storage) come from Swissolar's «Statistik Sonnenenergie», which is collected and extrapolated on behalf of the SFOE. It's the authoritative reference for anything concerning «Switzerland in year X».
All structural figures (canton comparison, system sizes, roof-integrated shares, locality table) are our own analysis of the public SFOE register «Electricity production plants», which is based on Pronovo's system data and can be obtained data.geo.admin.ch freely. All entries in the «Photovoltaik» subcategory were analysed, data as of 6 August 2026.
The most important limitation: the register reflects new installations with a delay, because a system only appears once it is registered – often months after commissioning. That's why the 26 cantonal figures add up to 8,635 MW, while Swissolar officially reports 9,498.6 MW for the end of 2025. The register therefore captures around 91 percent of capacity, with the gap concentrated clearly in the most recent months.
Three rules follow from this, which this page adheres to:
1. No annual new-installation figure from the register. For «how much was added in 2025», Swissolar alone applies. 2. 2026 is nowhere shown as an annual value – the register captures only a fraction of the current year. 3. Structural comparisons are robust, because the lag affects all cantons similarly. As a check, the per-capita ranking was calculated at three reference dates (end of 2023, end of 2024, current); the top and bottom groups remain identical, while in the middle field, individual cantons shift by a maximum of four ranks.
The analysis is reproducible. The script loads the raw data itself, recalculates this page's tables and checks the result against reference values:
node tools/build-pv-kantonsdaten.mjs --selftest
Use: this analysis may be cited and reused with attribution. We'd ask for a link to this page.
Frequently asked questions
How many solar systems are there in Switzerland?
At the end of 2025, 338,270 photovoltaic systems with a total capacity of 9,498.6 MW were installed (Swissolar, «Statistik Sonnenenergie 2025»). Solar power thus covers 13.71 percent of Swiss electricity consumption.
Which canton has the most solar power?
By absolute capacity, Bern (1,071 MW) leads ahead of Zurich (924 MW). Per capita, however, Appenzell Innerrhoden leads with 1,884 watts, ahead of Jura (1,880) and Thurgau (1,674). The Swiss average is 946 watts per capita.
Why did new installations decline in 2025?
1,333 MW were added in 2025 instead of 1,800 MW the year before – a drop of 26 percent and the first decline since 2017. Swissolar names the falling feed-in remuneration and energy-policy uncertainty as the main reasons.
How big is an average solar system in Switzerland?
The median is 12.1 kWp, the arithmetic mean 26.1 kWp. 86.9 percent of all systems stay under 30 kWp.
How many roof-integrated systems are there?
Across the entire stock, 12.7 percent of all systems are roof-integrated. Among systems commissioned in 2024, it was 8.1 percent – compared with around 20 percent in the years 2010 to 2013.
Where does the data come from?
National annual figures from Swissolar on behalf of the SFOE, all structural figures from the public SFOE register «Electricity production plants» (Pronovo data), population figures from the Federal Statistical Office. Details and limitations in the Methodology chapter.
Free initial consultation
Want to check Photovoltaics Switzerland in numbers for your own case?
We check the roof, incentives, self-consumption and the next sensible step for your address.
Photovoltaics Switzerland – installation by a specialist company →
Prefer to talk? +41 78 830 83 35
Swissolar-certified specialist company · ESTI installation authorisation (Art. 14 NIV) · in Zurich since 2017 · over 150 systems completed · a personal answer from the specialist company, no call centre
Sources: Swissolar, «Statistik Sonnenenergie 2025» on behalf of the Federal Office of Energy (published 10 July 2026) · Federal Office of Energy, geodata set «Elektrizitätsproduktionsanlagen» with Pronovo AG system data, obtained via data.geo.admin.ch (data as of 6 August 2026) · Federal Statistical Office, STAT-TAB px-x-0102010000_101, permanent resident population by canton 2025 · Swissolar, Swiss market figures («Solarmonitor»).
Last updated: 27 August 2026 · Author: ecoEn editorial team